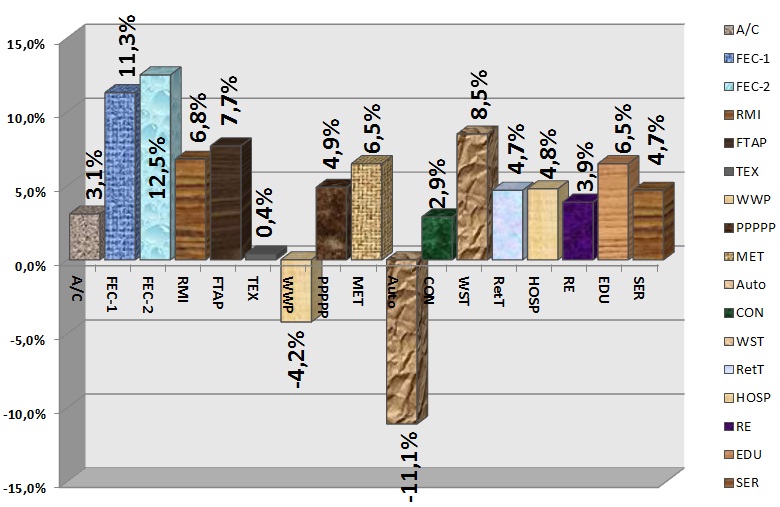
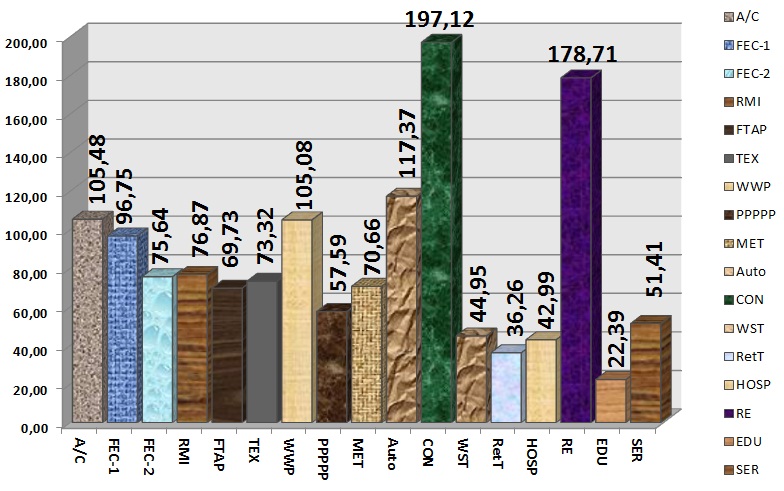
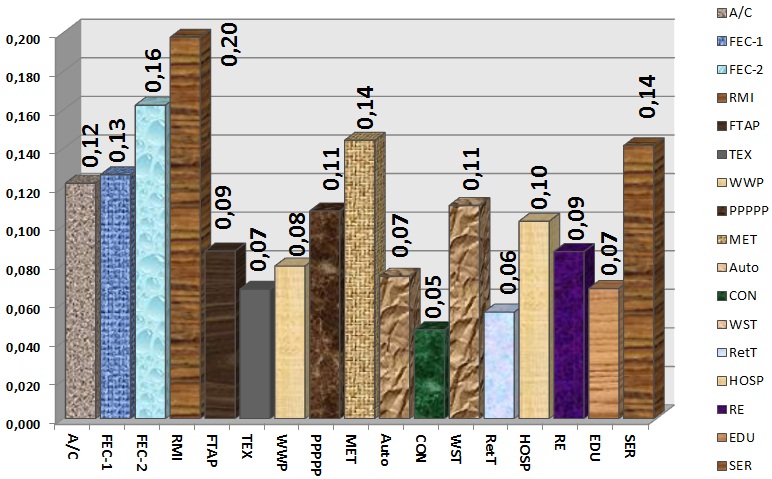
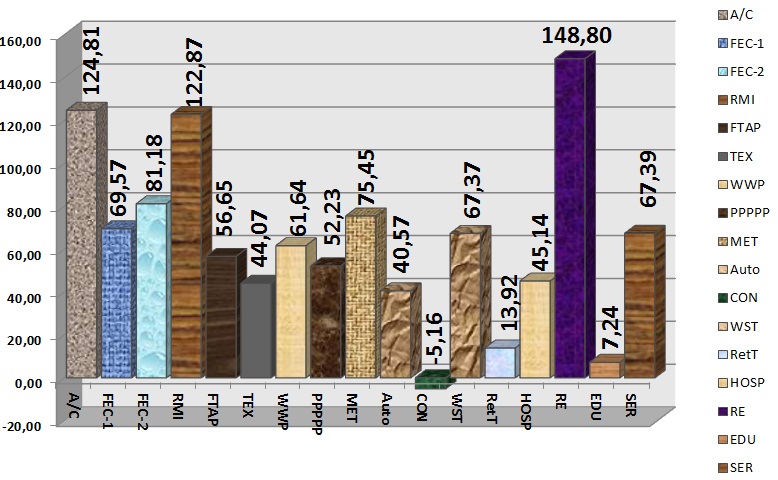
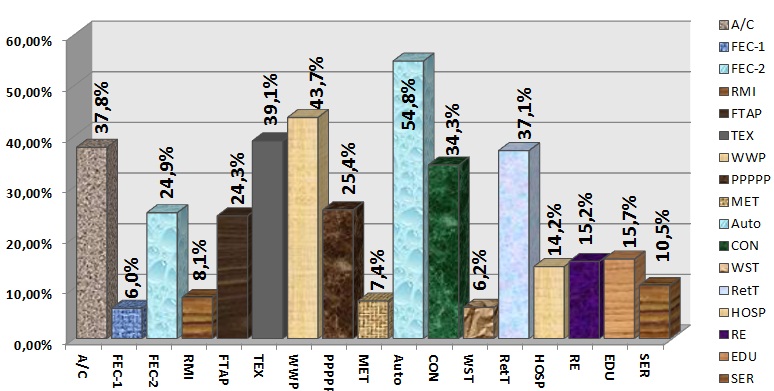
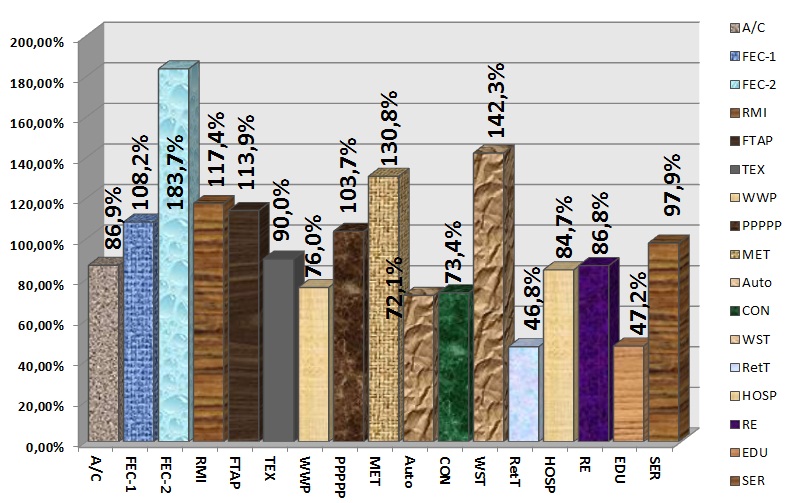
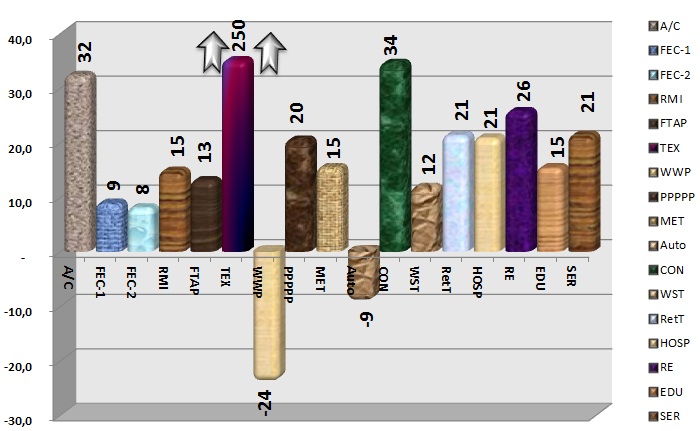
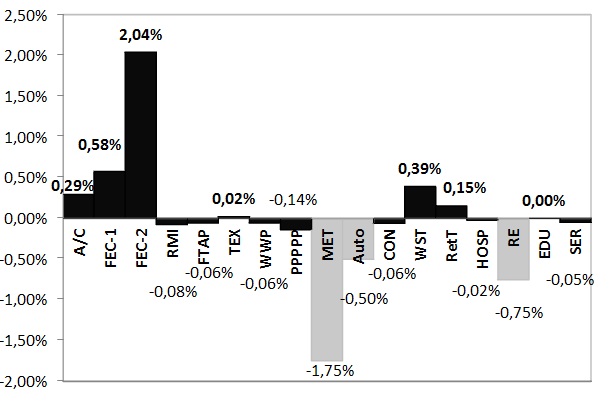
Histogram: Return on assets of companies by sector Alexander Shemetev
a1.jpg:780x507, 106k
|
|
|
|
Histogram: Return on assets of companies by sector Alexander Shemetev a1.jpg:780x507, 106k |
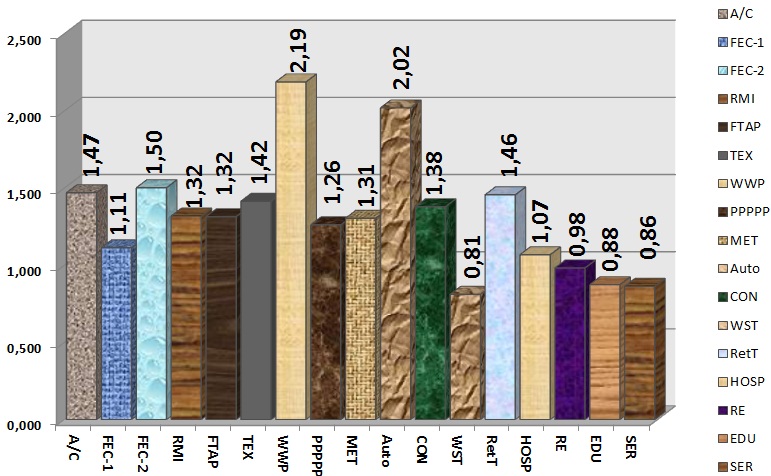
 Histogram: the industry average ratio of business activity of the average industry company in crisis conditions in 2009/2010, times per year Alexander Shemetev a10.jpg:769x486, 95k |
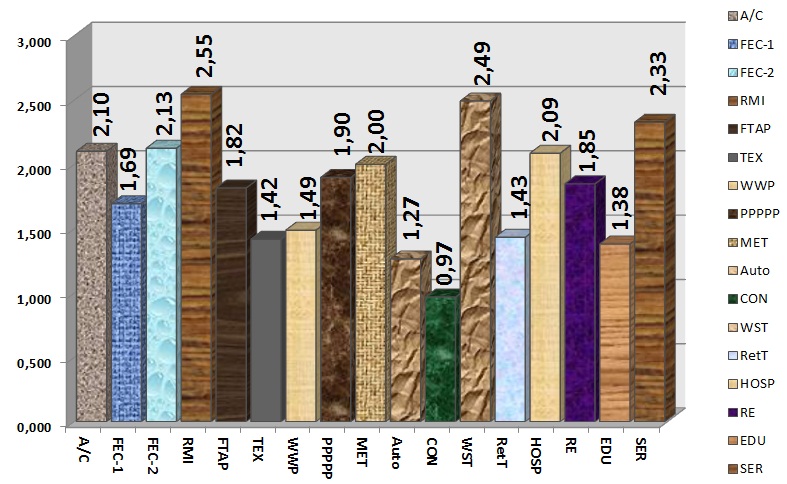
 Histogram: the industry average ratio of revenue to equity in an average company in sectors in 2009/2010, times per year Alexander Shemetev a11.jpg:785x493, 95k |
 Histogram: average in industries accounts receivable turnover term, expressed in days per year, 2009/2010 Alexander Shemetev a13.jpg:776x491, 134k |
 Histogram: average in industries accounts payable turnover term, expressed in days, 2009/2010 Alexander Shemetev a14.jpg:784x491, 126k |
 Histogram: average in industries total assets’ (company’s book value’s) turnover term, expressed in days, 2009/2010 Alexander Shemetev a15.jpg:778x482, 138k |
 Histogram: the industry average ratio of operating profit to costs, 2009/2010, % Alexander Shemetev a16.jpg:782x493, 112k |
 Histogram: the industry average current liquidity ratio, 2009/2010 Alexander Shemetev a17.jpg:787x484, 129k |
 Histogram: the industry average acid-test ratio, 2009/2010 Alexander Shemetev a18.jpg:772x479, 131k |
 Histogram: the industry average owned funds sufficiency ratio, 2009/2010 Alexander Shemetev a19.jpg:779x488, 102k |
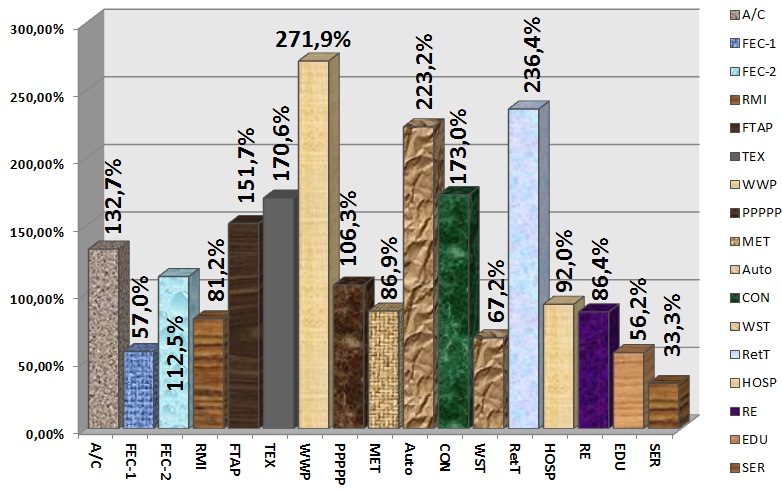
 Histogram: Return on sales of companies by sector Alexander Shemetev a2.jpg:800x507, 109k |
 Histogram: the industry average ratio of fixed assets in equity, 2009/2010 Alexander Shemetev a20.jpg:771x476, 119k |
 Histogram: A 21 of medium-sized company sector, 2009/2010 Alexander Shemetev a21.jpg:778x480, 121k |
 Histogram: remade by Alexander Shemetev formula: A21a for medium-sized company of a sector, 2009/2010 Alexander Shemetev a21a.jpg:779x481, 109k |
 Histogram: a medium-sized company by sector in terms of developed by Alexander Shemetev’s A21p indicator, 2009/2010 Alexander Shemetev a21p.jpg:776x408, 117k |
 Histogram: The ratio of net working capital to total assets for medium-sized company by sector, 2009/2010 Alexander Shemetev a22.jpg:779x499, 128k |
 Histogram: The index of the bankruptcy risk of the industry average company, 2009/2010 Alexander Shemetev a27.jpg:774x391, 103k |
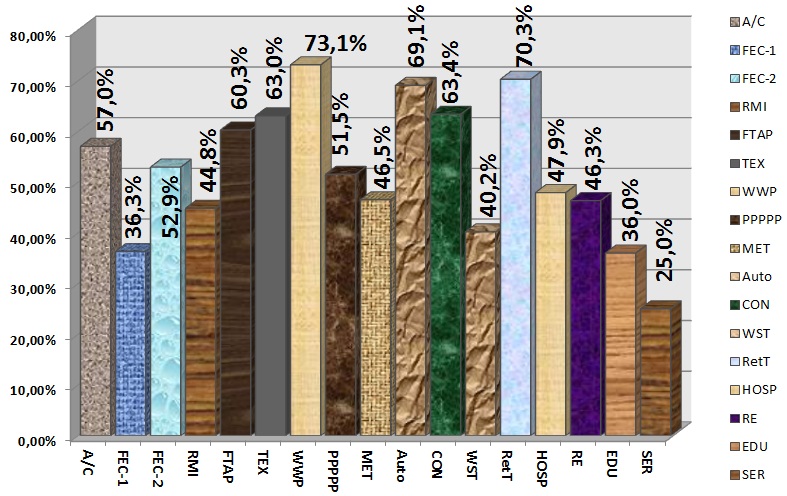
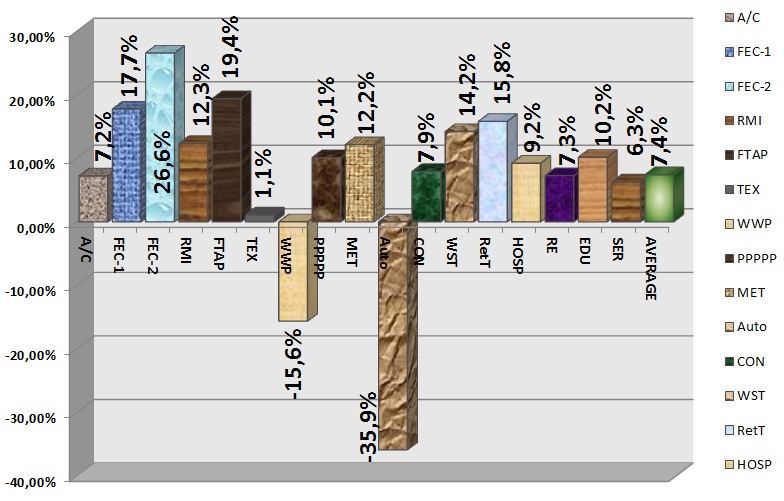 Histogram: Return on owned (equity) capital of industry-average company in 2009/2010, % Alexander Shemetev a3.jpg:784x501, 110k |
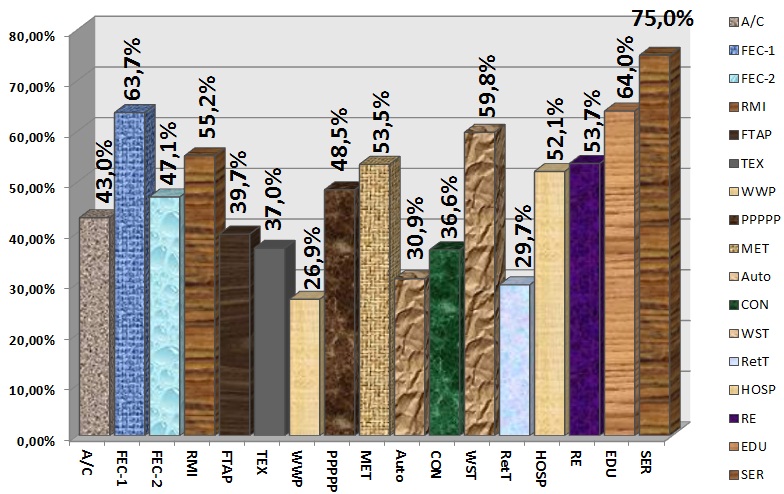
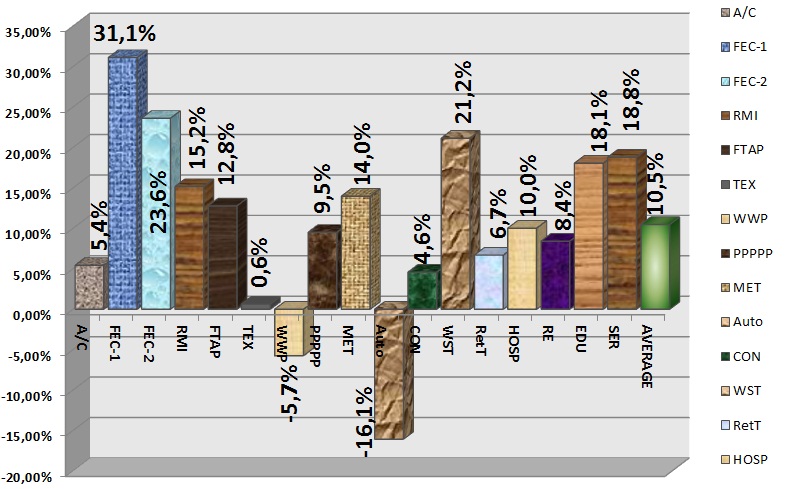 Histogram: Return on debt capital of an average company in the industry in 2009/2010, % Alexander Shemetev a4.jpg:785x489, 121k |
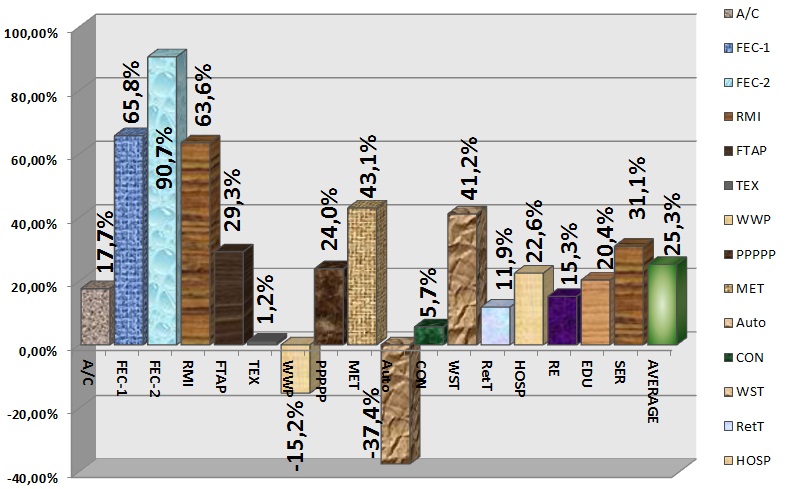 Histogram: Cost-effectiveness of short-term debt of the average company in an industry in 2009/2010, % Alexander Shemetev a5.jpg:786x489, 112k |
 Histogram: Ratio of accounts receivable and accounts payable of average companies by industries, 2009/2010, % Alexander Shemetev a6.jpg:790x503, 139k |
 Histogram: Ratio of debt and equity in industry average company of 2009/2010, % Alexander Shemetev a7.jpg:782x492, 125k |
 Histogram: Ratio of total debt to total assets of the industry average company in 2009/2010, % Alexander Shemetev a8.jpg:787x496, 146k |
 Histogram: Ratio of equity and total assets of the industry average company in 2009/2010, % Alexander Shemetev a9.jpg:784x494, 145k |
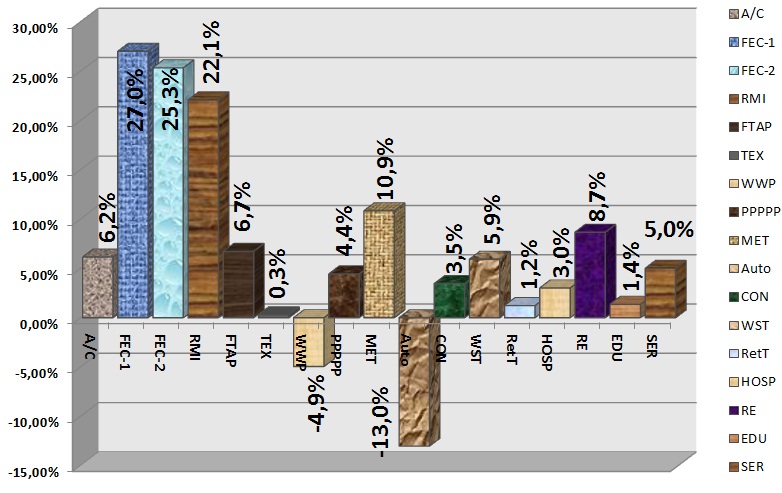
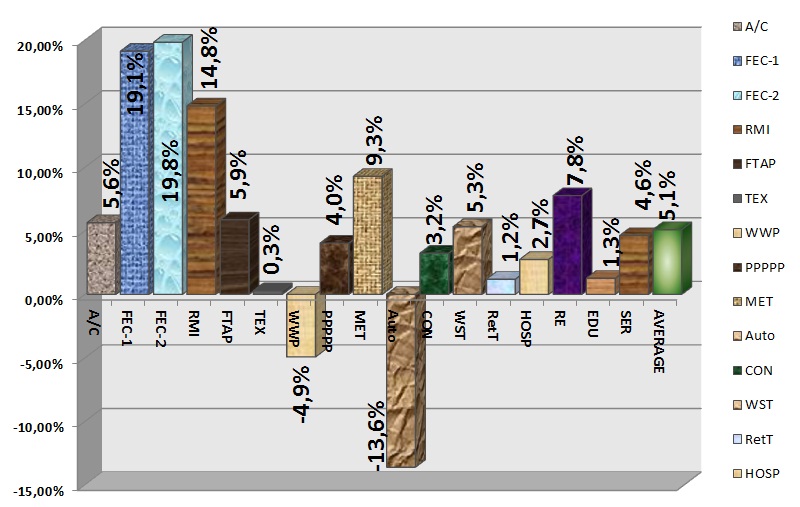
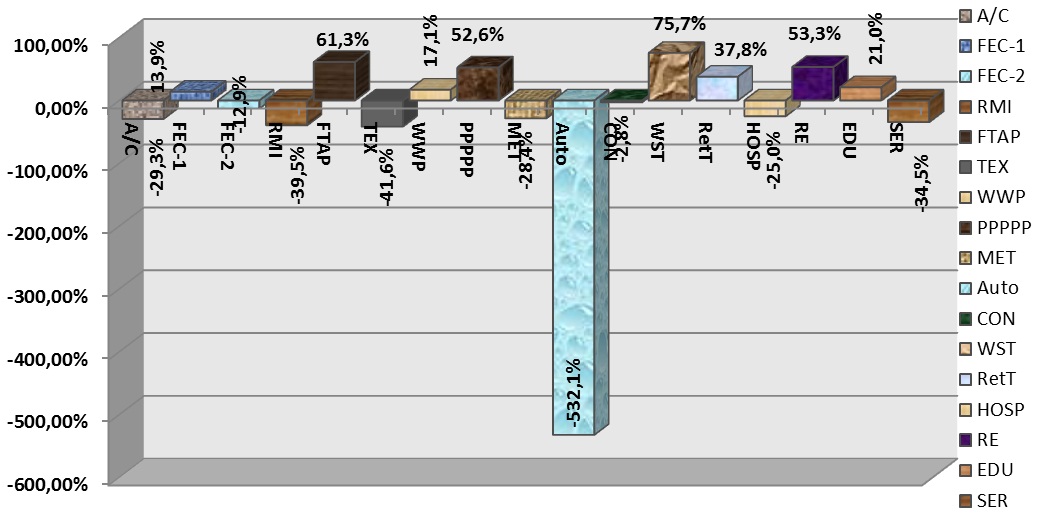 Histogram: The annual average revenue growth of companies in the industry in times of crisis 2009/2010, % Alexander Shemetev a91.jpg:1043x521, 110k |
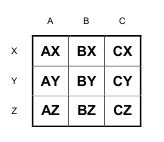 Table: ABC-XYZ matrix Alexander Shemetev abcxyz.jpg:164x142, 7k |
 Alexander Shemetev's photo Alexander Shemetev alexshemetev300dpi.jpg:300x301, 63k |
 Now we should use the coefficient β of the above formula, which will transfer the activity of the analyzed company into conventional activities: such as if it worked exactly in accordance with industry standards: Alexander Shemetev e1.jpg:529x212, 44k |
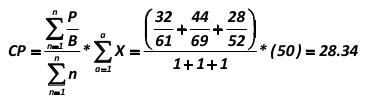
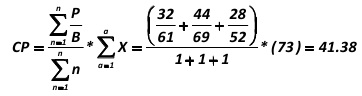 First, we calculate a comparable price Alexander Shemetev e10.jpg:362x96, 10k |
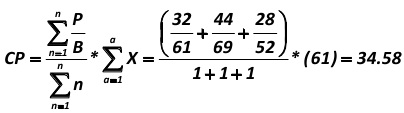
 The comparable price for curd "Normal" is: Alexander Shemetev e11.jpg:365x99, 11k |
 The comparable price for cottage cheese "K1" under given conditions is as follows: Alexander Shemetev e12.jpg:404x113, 13k |
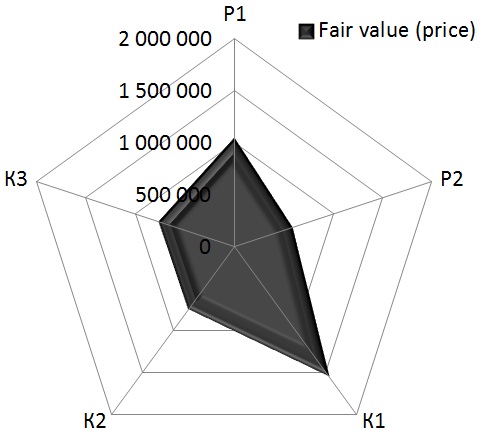
 Another method to determine a company's competitiveness in the market is a method for determining fair value. For the curd-cheese "Snowball," this figure will be: Alexander Shemetev e13.jpg:524x79, 12k |
 Let’s calculate the fair value for P1: Alexander Shemetev e14.jpg:549x101, 14k |
|
In this example, the risk for the company not to make the expected profit is: Alexander Shemetev e15.jpg:510x26, 8k |
|
In this example, the coefficient is equal to: Alexander Shemetev e16.jpg:193x35, 4k |
|
Let’s begin by calculating the coefficient (a) for the product P1 (A (P1)): Alexander Shemetev e17.jpg:533x43, 9k |
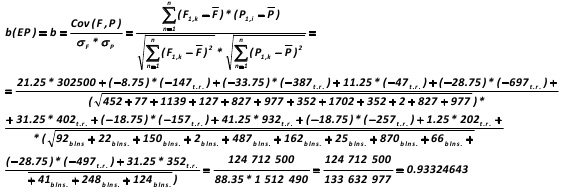 For example, let’s calculate the correlation between the index of the engine power (EP) and prices for the products in the test segment (b (EP)): Alexander Shemetev e18.jpg:562x192, 47k |
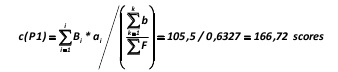 Specified above analysis is the basis of adequate scoring in order to bring non-price performance relative to a comparable value, which would include all the important factors in the market segment, including price. Let’s define the coefficient (c): Alexander Shemetev e19.jpg:338x72, 6k |
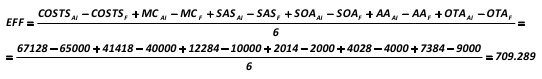 Now let’s calculate the monetary value for the effect of the use of leadership strategies on costs: Alexander Shemetev e2.jpg:542x79, 17k |
|
Then the rise in its market segment by the end of 2012 will be: Alexander Shemetev e20.jpg:443x36, 7k |
|
Let’s find the index of Discount: Alexander Shemetev e21.jpg:351x41, 6k |
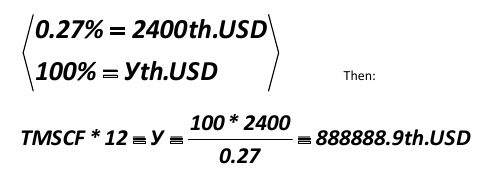 I should say that we know of only 0.27% of weight in the market. As you remember, the formula uses the very cost of market segment, that is, the cost (weight) of 100% of the market. The company forgot to specify it, and it is easy to calculate the proportion of it (509): Alexander Shemetev e22.jpg:484x184, 20k |
 We can now find the true proportion of the market in 2011: Alexander Shemetev e23.jpg:517x145, 23k |
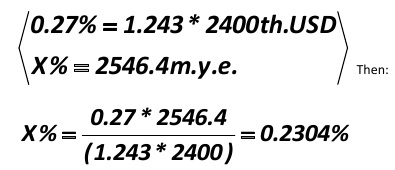 First you need to find the index of discount (we have it 1.243). Then we should find a proportion: Alexander Shemetev e24.jpg:395x170, 21k |
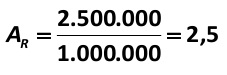 We should now find the value of correction factor in the micro-segment, Ar: Alexander Shemetev e25.jpg:227x75, 6k |
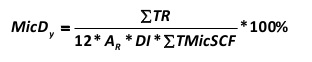
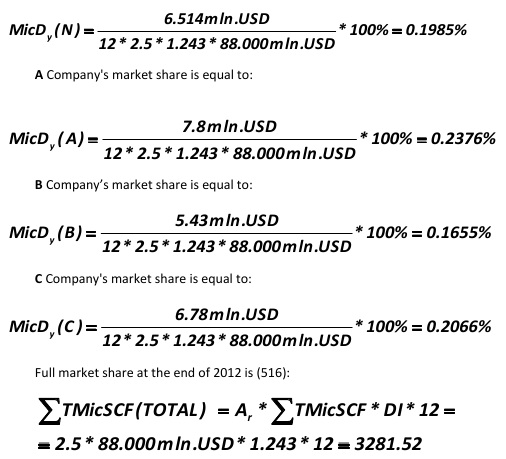 MicDy – is the market share, calculated at the rate per one year. Alexander Shemetev e26.jpg:506x459, 68k |
 For our example, the share of other companies in the market segment is in absolute values: Alexander Shemetev e27.jpg:544x90, 23k |
|
If you do not have these opportunities, you can do it roughly, approximately, at your discretion. In our case this value will be: Alexander Shemetev e28.jpg:490x37, 8k |
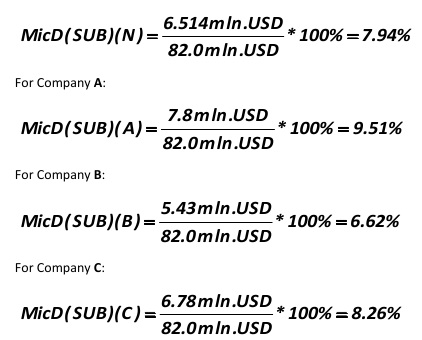 For our company, the shares they occupy in the sub-segment of the consumer market’s micro-segment are: Alexander Shemetev e29.jpg:422x340, 40k |
 The overall effect of the application of leadership strategies based on the costs for Co Ltd "Kama" is: Alexander Shemetev e3.jpg:516x73, 19k |
|
In our example, this value is: Alexander Shemetev e30.jpg:516x20, 7k |
|
In our example, this value is: Alexander Shemetev e31.jpg:528x18, 8k |
|
Let us, together with you, calculate the other comparable figure of the effect: Alexander Shemetev e4.jpg:461x33, 7k |
 You should also calculate other performance indicators for company at the market: Alexander Shemetev e5.jpg:434x127, 27k |
 You should also calculate other performance indicators for company at the market: Alexander Shemetev e6.jpg:450x270, 57k |
 Let us compute the external effects of its operation at the market: Alexander Shemetev e7.jpg:556x179, 34k |
 It should also be evaluated other performance indicators for business systems on the market: Alexander Shemetev e8.jpg:459x100, 13k |
 You should also calculate other indicators: Alexander Shemetev e9.jpg:524x365, 45k |
|
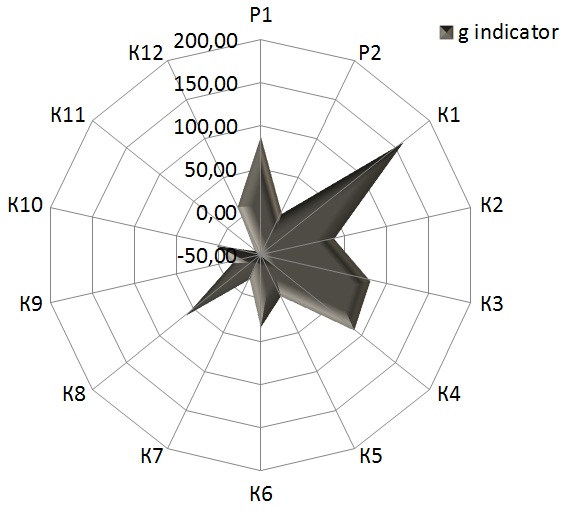
The resulting model’s indicator is the coefficient (g), which calculation is presented above in this paper. In terms of the above factors, figure (g) for the i-th company in the market segment will be calculated by the formula: Alexander Shemetev f-52.jpg:157x41, 2k |
|
The New Market was opened after the transition to a market economy; the segmentation of this New Market was a term nobody thought about. Instead of this, companies, usually, used a simple calculation model: cost + standard of profitability, which can be expressed in the following formula (1) Alexander Shemetev f1.jpg:537x36, 7k |
|
The overall effectiveness of the company at the market will be calculated by the formula (10): Alexander Shemetev f10.jpg:533x37, 12k |
|
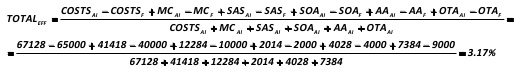
You can use the following indicator developed by the author of this paper to find a relative measure of company’s performance at the market (we have already counted an absolute indicator of efficiency), which shows the extent to which the average analyzed company can be successfully compared with its competitors (11): Alexander Shemetev f11.jpg:192x34, 3k |
|
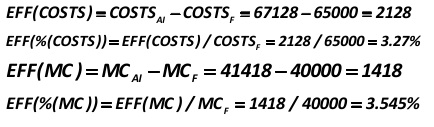
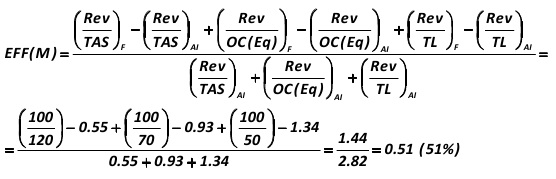
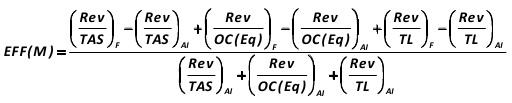
Also, all the elements of material costs should be compared with industry averages, which would have the following simple algorithm. To calculate the efficiency of the total cost you should use the next formulas, developed by the author of this paper: Alexander Shemetev f12.jpg:293x34, 5k |
|
Also, all the elements of material costs should be compared with industry averages, which would have the following simple algorithm. To calculate the efficiency of the total cost you should use the next formulas, developed by the author of this paper: Alexander Shemetev f13.jpg:348x35, 6k |
|
Indicator of the effect of material costs will be calculated by the formulas, developed by the author of this paper: Alexander Shemetev f14.jpg:224x30, 4k |
|
Indicator of the effect of material costs will be calculated by the formulas, developed by the author of this paper: Alexander Shemetev f15.jpg:268x30, 5k |
|
Indicator of the effect of contributions on wages of production workers (payroll) will be calculated by the formulas, developed by the author of this paper: Alexander Shemetev f16.jpg:214x30, 4k |
|
Indicator of the effect of contributions on wages of production workers (payroll) will be calculated by the formulas, developed by the author of this paper: Alexander Shemetev f17.jpg:273x30, 5k |
|
Indicator of the effect of social security contributions should be calculated by the formulas, developed by the author of this paper: Alexander Shemetev f18.jpg:221x27, 4k |
|
Indicator of the effect of social security contributions should be calculated by the formulas, developed by the author of this paper: Alexander Shemetev f19.jpg:296x33, 6k |
|
There was also a scientific and a rarely used in practice model to determine the optimal price of the goods. It was associated with so-called variable costs. In summary it can be expressed as follows (2) Alexander Shemetev f2.jpg:555x31, 7k |
|
Indicator of the effect of depreciation should be calculated by the formulas, developed by the author of this paper: Alexander Shemetev f20.jpg:199x31, 3k |
|
Indicator of the effect of depreciation should be calculated by the formulas, developed by the author of this paper: Alexander Shemetev f21.jpg:259x33, 5k |
|
Indicator of the effect of other payments will be calculated by the formulas, developed by the author of this paper: Alexander Shemetev f22.jpg:236x30, 4k |
|
Indicator of the effect of other payments will be calculated by the formulas, developed by the author of this paper: Alexander Shemetev f23.jpg:289x30, 6k |
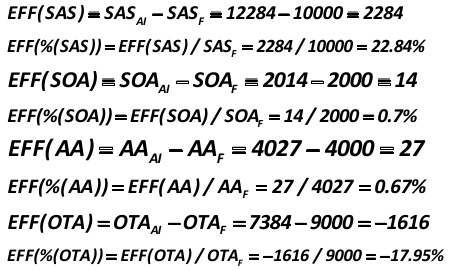
 The total external / market / effect of the use of cost leadership strategy for domestic companies is (25): Alexander Shemetev f25.jpg:512x103, 19k |
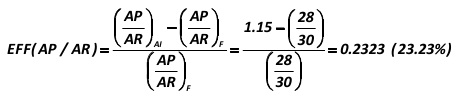
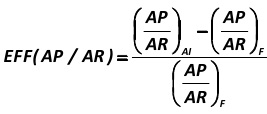 The overall effect of accounts receivables and payables management policy is directly related to the maximization of sales: Alexander Shemetev f26.jpg:267x114, 8k |
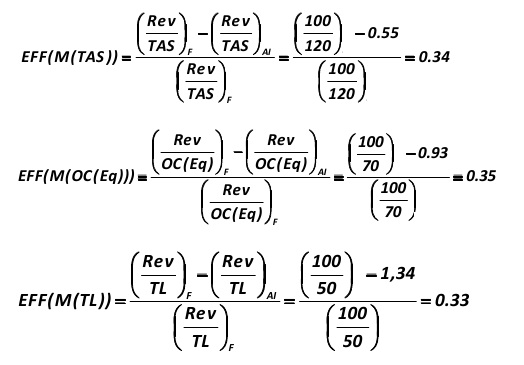
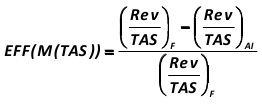 Along with the overall effect, it should be calculated also the private effect of applying by a company this strategy of leadership in cost for each indicator. In terms of total asset turnover it is calculated in the following way: Alexander Shemetev f27.jpg:262x104, 9k |
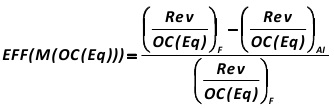 In terms of OC(Eq) turnover, effect is as follows: Alexander Shemetev f28.jpg:334x108, 11k |
 In terms of TL turnover, the effect is: Alexander Shemetev f29.jpg:277x115, 9k |
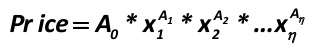
 With the advent of market economy, the market began to saturate gradually. Then, gradually became more popular following type of calculation of the total price of the product (3) Alexander Shemetev f3.jpg:538x54, 14k |
 The comparable price for a unit of conventional product (ComP), a member of the company's product line is: Alexander Shemetev f30.jpg:237x119, 7k |
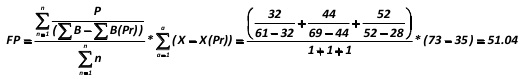
 Fair price (FP) for conventional production units will be assessed as follows: Alexander Shemetev f31.jpg:279x89, 7k |
 There is a more demonstrable way to represent the volume of segment of the market by company's competitiveness index at the market. For these purposes, the fair or comparable price for the main line of each type of product (it can be chosen the most competitive product on each line) should be transformed according to the following formula, developed by the author of this paper: Alexander Shemetev f32.jpg:231x56, 4k |
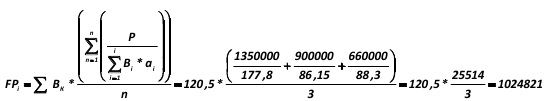
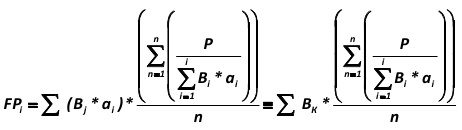 A fair price for the product line (FPi) is: Alexander Shemetev f33.jpg:462x130, 15k |
 The transformation takes place in accordance with the formula, developed by the author of this paper: Alexander Shemetev f34.jpg:259x62, 6k |
|
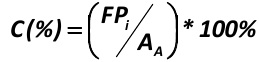
The general view of the definition of competitiveness at the market can be described as follows by this method: Alexander Shemetev f35.jpg:253x46, 4k |
 Or: Alexander Shemetev f36.jpg:319x52, 5k |
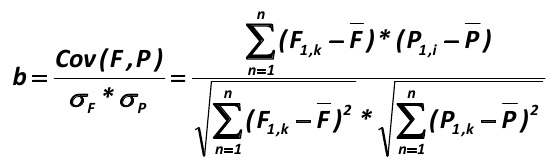
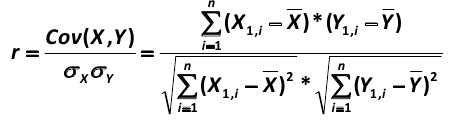 To determine the author's model, you, my dear reader, should be familiar with the concept of correlation. Correlation (r) - is the mathematically expressed linear relationship between two variables. It is calculated by the formula: Sir Francis Galton f37.jpg:455x124, 16k |
 It should be noted that: Sir Francis Galton f38.jpg:225x100, 7k |
 This is how the calculation of the mathematical expectation looks like, the mathematical expectation of likely average yield at the market (AY(PI) – Average Yield and Probable Income): Blaise Pascal f39.jpg:183x83, 4k |
|
The price of a new product introduction for such companies is: Alexander Shemetev f4.jpg:152x40, 2k |
 If the value of standard deviation ( ) is divided by the probability the most probable revenue margin, we shall obtain a coefficient of variation: Sir Francis Galton f40.jpg:179x77, 3k |
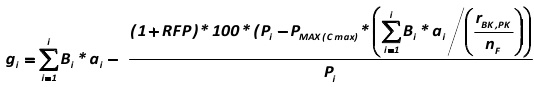 The general mathematical form of the sum of comparable scores reflecting the company's competitiveness in the market and the prospects for change in its position within the market segment (gi) are expressed by the following formula, developed by the author of this paper (41): Alexander Shemetev f41.jpg:534x87, 11k |
 Coefficient (a) expresses the amount of non-price factors of some company at the market, taking into account the mathematical discrimination; it is calculated as follows (by the formula, developed by the author of this paper): Alexander Shemetev f42.jpg:156x75, 3k |
 After the calculation of this coefficient, you, my dear reader, should perform a calculation of the coefficient b, which expresses the relationship between the market-adequate estimation of every important parameter included in the model with respect to the perception of price by consumer (b ratio methodology is also developed by the author of this paper) (43): Alexander Shemetev f43.jpg:560x164, 22k |
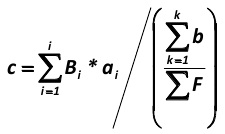 The third step is to calculate the coefficient (c), which shows the average dependence per a single average score factor for a company in the market from price changes (P). It is calculated as follows for the i-th company in the market segment (by the formula, developed by the author of this paper): Alexander Shemetev f44.jpg:225x134, 8k |
 The following coefficient d aligns all commodities and products in the analyzed segment of the market under the reference of the best consumer features, combined with the price of goods. This operation is carried out by a simple transformation: Alexander Shemetev f45.jpg:150x74, 3k |
|
If you, my dear reader, subtract the indicator (di) of 1 (1 – di), we obtain the indicator (e), which expresses the deviation of consumer-relevant properties of the product – relative to the price of that state as if the i-th product in the market would have a benchmark performance for optimal price-performance ratio : Alexander Shemetev f46.jpg:125x32, 2k |
|
Then, on the basis of the available properties and characteristics of the product, it is calculated reference price for the i-th product (f), which optimally combines the available relevant to the consumer characteristics of goods and brings them to the point of optimal price: Alexander Shemetev f47.jpg:268x42, 5k |
|
Further, it should be calculated next: the amount of calculated price deviation of i-th product in the market segment from the reference price for the i-th product: Alexander Shemetev f48.jpg:159x48, 3k |
|
The next coefficient (h) is the actual deviation for the product from the standard, expressed as a percentage: Alexander Shemetev f49.jpg:128x34, 2k |
|
Multiplicative expression of common percentage (MEC) is estimated by a simple formula Alexander Shemetev f5.jpg:167x34, 3k |
|
The coefficient (i) virtually completes the analysis of a company's competitiveness in the market segment, and it assesses company’s occupied segment. This indicator points to how much the average score deviates from the reference price listed: Alexander Shemetev f50.jpg:233x37, 4k |
 Dear reader, I’d like to make the further numeration of my formulas like in my Russian book, if you have nothing against it – let the next formula to be 502 and so on. Alexander Shemetev f502.jpg:212x64, 5k |
 However, as you, my dear reader, remember, the loan process does not describe the whole structure of negative cash flow coming from, or, actually, to "third parties". In order to evaluate the fact, how many days a year a company is working on others, the author of this paper, Alexander Shemetev, developed the following formula. The formula describes: how many days in maximum company works “for the others”: Alexander Shemetev f503.jpg:182x66, 4k |
 It should be noted that the author of this paper, Alexander Shemetev, believes it is more rational to define the current fiscal deficit of a bit different conditional ratio for a single company (rather than the industry average for companies). The author of this paper, Alexander Shemetev, modified the formula to calculate the deficit in the next way: Alexander Shemetev f504.jpg:341x56, 6k |
 It can be calculated on a formula developed by the author of this paper, Alexander Shemetev: Alexander Shemetev f505.jpg:240x67, 5k |
 Use the following formula developed by the author of this paper: Alexander Shemetev f506.jpg:400x82, 9k |
|
Then, multiply the value by the inverse of the discount index (DI). The index of the discount (DI) is calculated by a formula developed by the author of this paper: Alexander Shemetev f507.jpg:395x38, 8k |
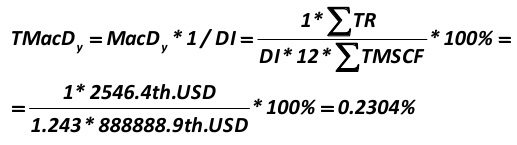
 Then you should multiply the resulting amount you have on the overall MacDy discount index (DI) as shown in the formula below, developed by the author of this paper: Alexander Shemetev f508.jpg:340x56, 7k |
|
The resulting model’s indicator is the coefficient (g), which calculation is presented above in this paper. In terms of the above factors, figure (g) for the i-th company in the market segment will be calculated by the formula: Alexander Shemetev f51.jpg:157x41, 2k |
|
This should be done as shown in the following formula developed by the author of this paper (510) (calculated per 1 million inhabitants): Alexander Shemetev f510.jpg:493x27, 6k |
 Let your local Population is (P) residents. The number of P can be 100 people, it may be 1000, it may be 2 million, and so on. In order to determine the total capacity of the market in your area, you need to multiply all the obtained figures by the segments correction coefficient, which is calculated by a formula developed by the author of this paper: Alexander Shemetev f511.jpg:235x102, 5k |
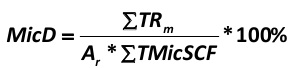 In order to calculate your share of the market or any other company’s share of the market in this micro-segment, you must use the below formula developed by Alexander Shemetev: Alexander Shemetev f512.jpg:291x68, 7k |
 To do this, you can also use a formula developed by the author of this paper: Alexander Shemetev f513.jpg:300x61, 6k |
|
Then multiply the resulting amount you have on the overall MicDy discount index (DI) as shown in the formula developed by the author of this paper: Alexander Shemetev f514.jpg:243x30, 4k |
 Let us now forecast the share of each company in the market, using the following formula developed by the author of this paper: Alexander Shemetev f515.jpg:312x62, 5k |
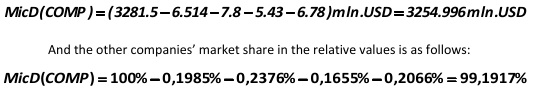
 Full market share at the end of 2012 is (516): Alexander Shemetev f516.jpg:401x63, 7k |
 Then the formula 515, on which we counted our company – can be written in a simpler form: Alexander Shemetev f517.jpg:301x53, 6k |
|
The share occupied by other companies in this market micro-segment in relative values is: Alexander Shemetev f518.jpg:362x31, 7k |
|
The share of the market’s micro-segment of other companies in absolute terms is unaccounted for: Alexander Shemetev f519.jpg:437x31, 7k |
|
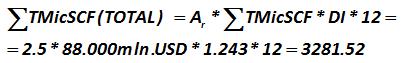
So, let’s go back to our example. Our sub-segments is only 2.5% of total micro-segment of market of food products in the region of 2.5 million inhabitants. Then, let’s apply the formula, developed by the author of this paper: Alexander Shemetev f520.jpg:426x25, 8k |
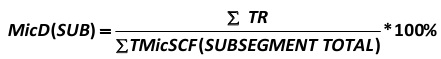 That is, it is that part of the market, where the main competition is. Our company is constantly fighting for the distribution of 51.7 million USD profit in its sub-segment. Then the market share will be calculated from the formula, developed by the author of this paper: Alexander Shemetev f521.jpg:441x59, 10k |
|
So, these are the shares of the major players inside this market sub-segment. The total amount of sub-segment’s shares which are not busy by other competitors are (they are calculated by the formulas developed by the author of this paper): In relative values: Alexander Shemetev f522.jpg:382x31, 7k |
|
Absolute values for calculating the overall market share of other firms are calculated using the formula developed by the author of this paper: Alexander Shemetev f523.jpg:398x30, 6k |
|
However, this does not mean that all products should be introduced, whose P(NP) will be maximum, as well as the set I(NP) parameter. It should be remembered that the basis for the development strategy of this type for companies should be: Alexander Shemetev f6.jpg:222x30, 3k |
|
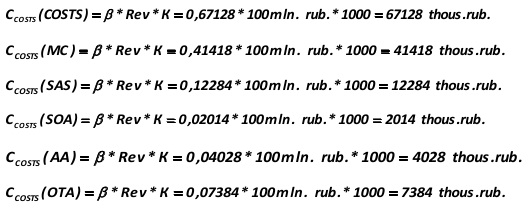
The value of industry average costs by cost components for individual companies within the industry is calculated as follows: Alexander Shemetev f7.jpg:210x32, 3k |
|
K – is the conversion coefficient of revenue to thousands of rubles, which is calculated by the formula: Alexander Shemetev f8.jpg:176x36, 3k |
|
Effect /which is a conditional, not actual value; and its need will be explained at an example! / from the application of the strategy will be calculated by the formula developed by the author of this paper (9): Alexander Shemetev f9.jpg:528x39, 8k |
|
Typographic sign g.jpg:18x14, 0k |
 Histogram: The book value of an average company in an industry, thousand rubles Alexander Shemetev h1.jpg:781x496, 99k |
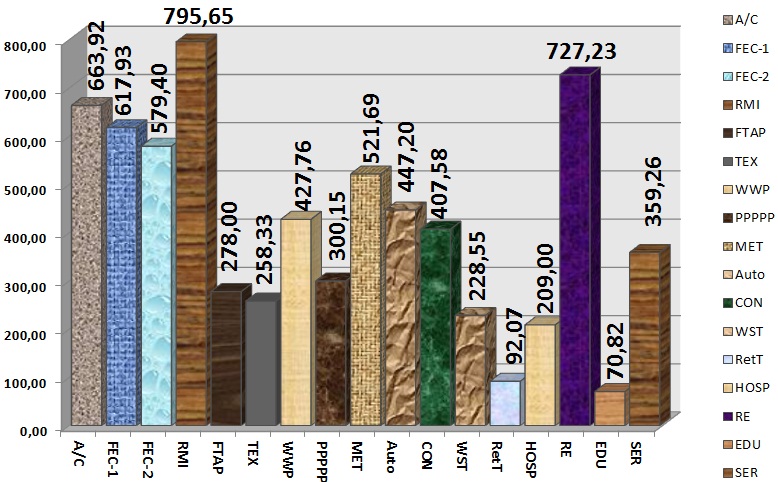
 Histogram: The volume of the average company’s revenue by industry, thousand rubles Alexander Shemetev h2.jpg:780x502, 105k |
 Multi-sectoral diagram of bifurcation shifts in the branches of Russian economy Alexander Shemetev h3.jpg:837x466, 74k |
 Histogram: average return on assets of the company by industry, % Alexander Shemetev h4.jpg:678x436, 83k |
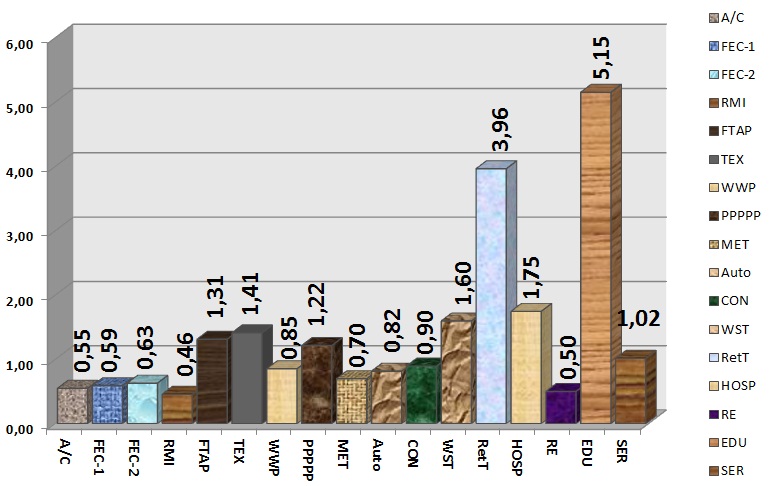
 Histogram: The average payback period of investment to company by industry, years Alexander Shemetev h5.jpg:700x431, 79k |
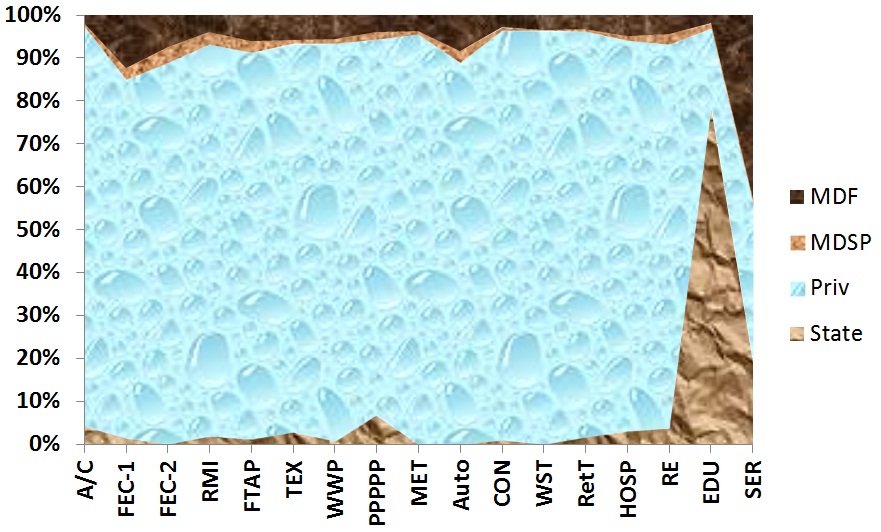 Chart: Ownership of Companies in Russia Alexander Shemetev h6.jpg:881x532, 138k |
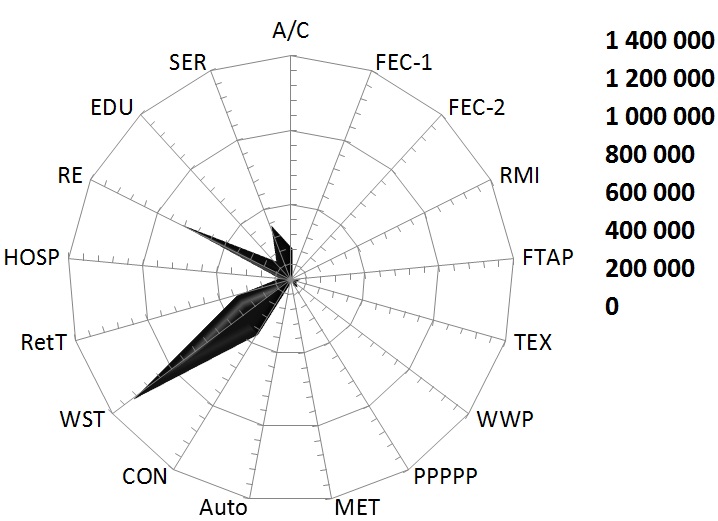 Arachnoid diagram: the concentration of competition in the Russian market by sector (by number of companies in each industry, pcs.) Alexander Shemetev h7.jpg:718x521, 85k |
|
this are the standard deviations, which show the total amount on which the parameters will be rejected (not to repeat the word “deviated”) by average measure Sir Francis Galton lit1.jpg:45x16, 1k |
|
Alexander Shemetev lit10.jpg:110x23, 2k |
|
Alexander Shemetev lit11.jpg:229x19, 4k |
|
Alexander Shemetev lit13.jpg:44x21, 1k |
|
Alexander Shemetev lit14.jpg:132x20, 2k |
|
Alexander Shemetev lit16.jpg:98x16, 1k |
|
Standard deviation sign Sir Francis Galton lit2.jpg:15x14, 0k |
|
lit3.jpg:63x26, 1k |
|
Alexander Shemetev lit4.jpg:49x18, 1k |
|
Alexander Shemetev lit7.jpg:102x24, 2k |
|
Alexander Shemetev lit8.jpg:100x19, 2k |
|
Alexander Shemetev lit9.jpg:143x23, 3k |
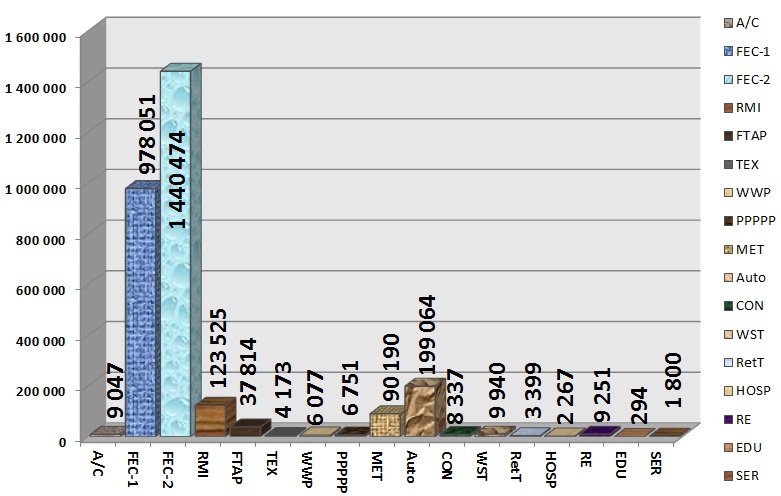
 Scheme: Average structure of the total value of the tax base by sector from 2000 to 2010 Alexander Shemetev s1.jpg:674x487, 107k |
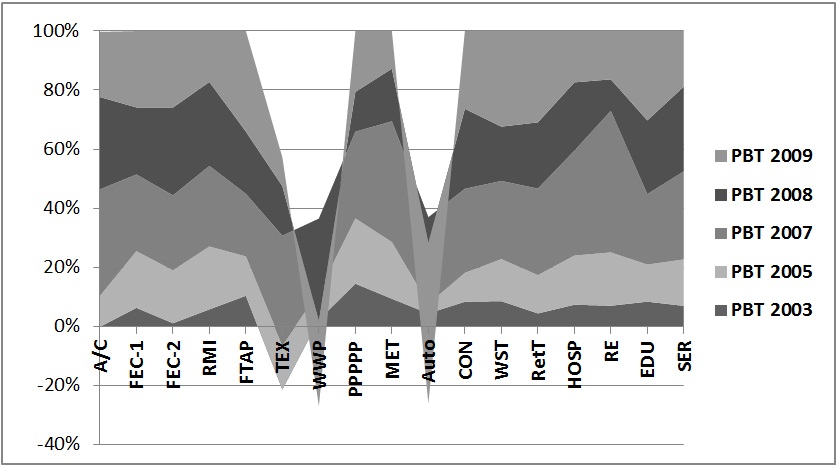
 Graph: Histogram of the structural changes of industries in terms of a structural shift of the tax base on data from 2003 and 2010 Alexander Shemetev s2.jpg:611x411, 52k |
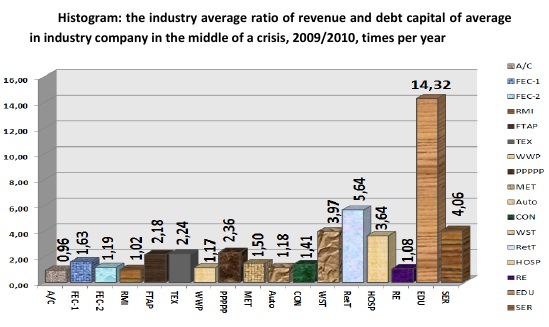 Histogram: the industry average ratio of revenue and debt capital of average in industry company in the middle of a crisis, 2009/2010, times per year Alexander Shemetev s27.jpg:549x327, 59k |
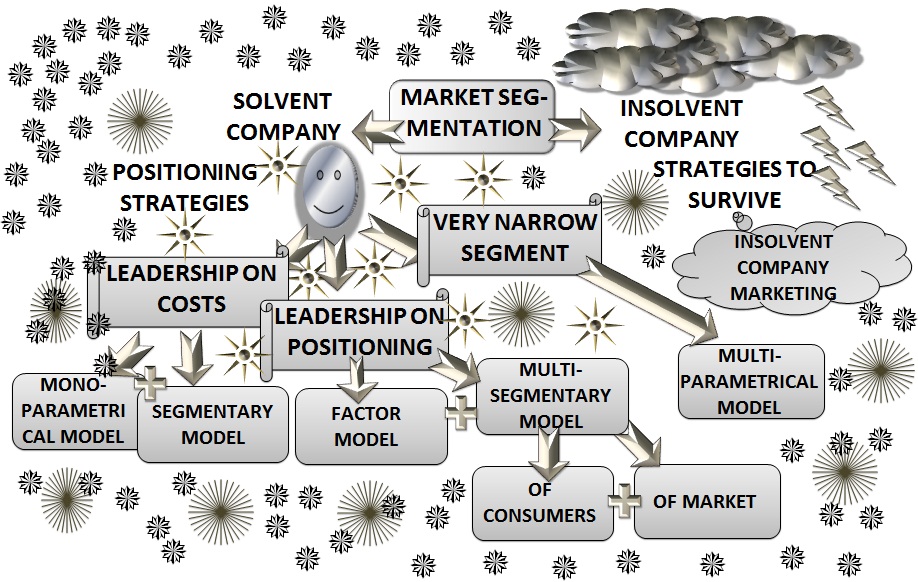 Scheme: the Alexander Shemetev’s method: company’s segmentation at market Alexander Shemetev s3.jpg:918x582, 233k |
 Arachnoid Chart: Competitiveness of the company "Ugra" in the market, determined by the method of comparable rates Alexander Shemetev s4.jpg:736x500, 49k |
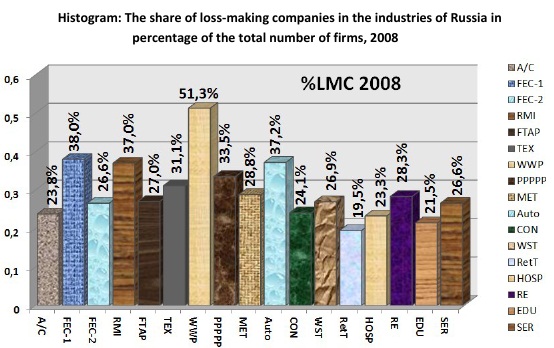 Histogram: The share of loss-making companies in the industries of Russia in percentage of the total number of firms, 2008 Alexander Shemetev s45.jpg:554x348, 77k |
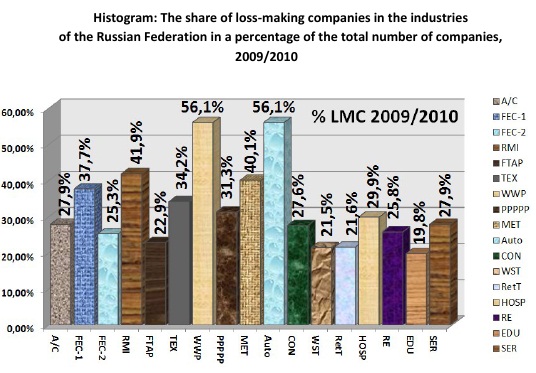 Histogram: The share of loss-making companies in the industries of the Russian Federation in a percentage of the total number of companies, 2009/2010 Alexander Shemetev s46.jpg:536x373, 82k |
 Arachnoid sector chart: Competitiveness of the company "Ugra" at market, defined by the fair price Alexander Shemetev s5.jpg:514x446, 40k |
 Arachnoid-sector chart: Competitiveness of JSC "NTAZ" at market, defined by the fair price Alexander Shemetev s6.jpg:487x447, 41k |
 Segmental arachnoid diagram: Competitiveness in the market segment by Alexander Shemetev’s regression analysis (a-g) Alexander Shemetev s7.jpg:565x511, 59k |
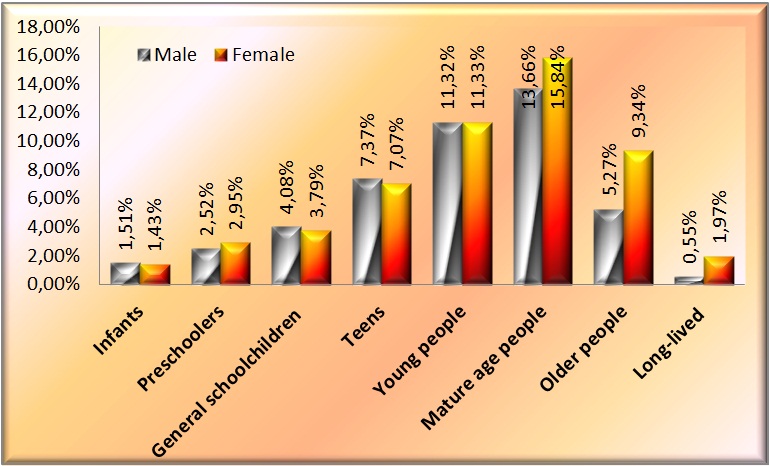 The sex-and age-grading of the population in Russia in 2008 Alexander Shemetev st01.jpg:770x466, 106k |
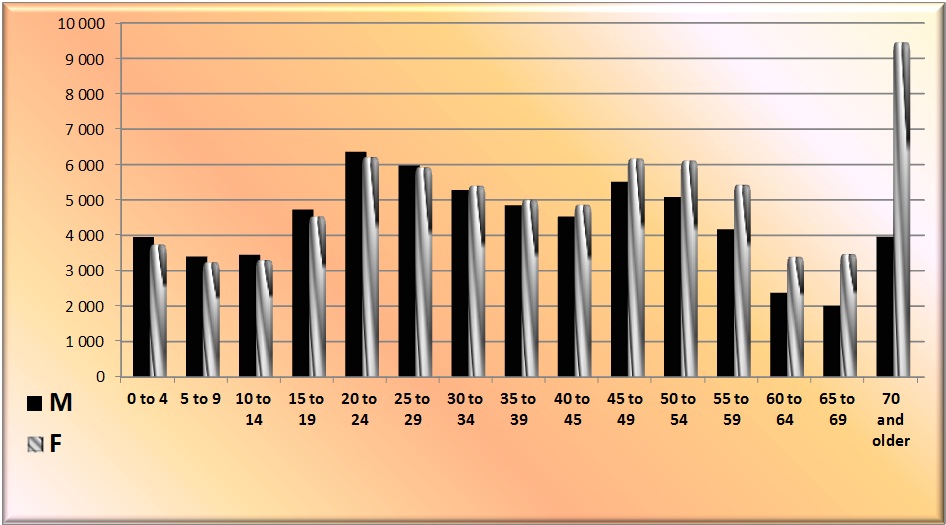 The sex-and age-grading of the population in Russia in 2010 Alexander Shemetev st2.jpg:946x525, 123k |
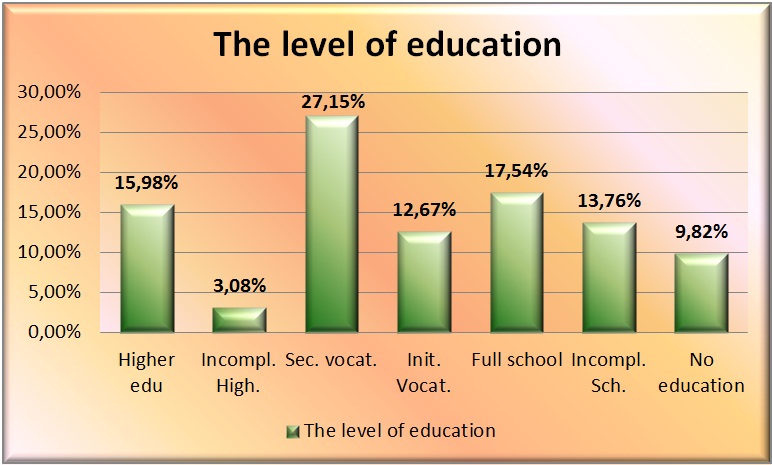 The level of education in Russia Alexander Shemetev st3.jpg:772x465, 95k |
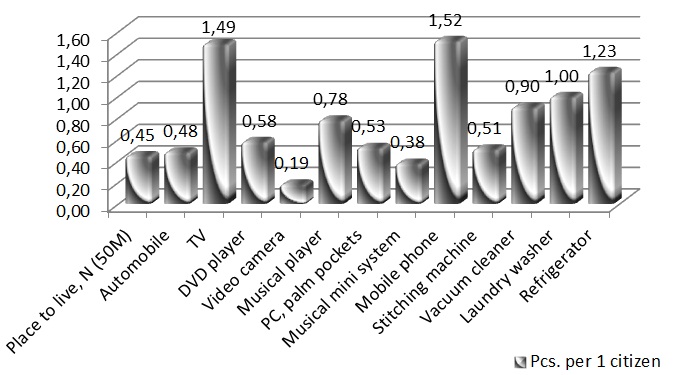 Histogram: Average personal luxury accessories in the Russian Federation in 2010, pieces Alexander Shemetev st4.jpg:681x375, 75k |
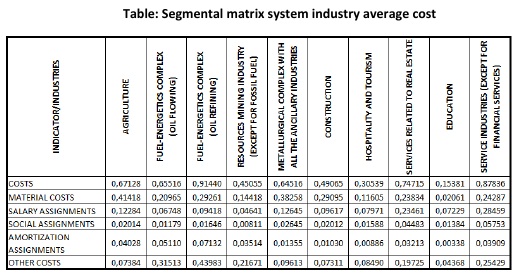 Table: Segmental matrix system of industry average cost Alexander Shemetev t1.jpg:516x275, 73k |
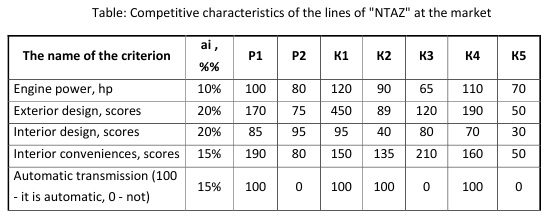 Table: Competitive characteristics of the lines of "NTAZ" at the market Alexander Shemetev t10.jpg:547x216, 49k |
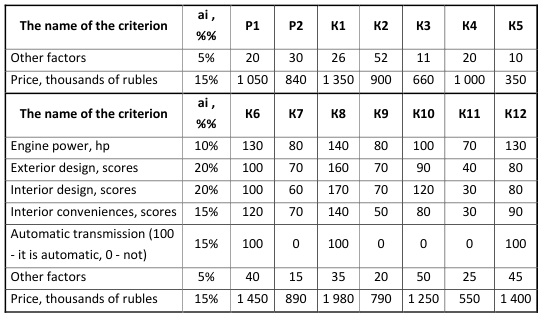 Table: Competitive characteristics of the lines of "NTAZ" at the market Alexander Shemetev t11.jpg:547x320, 74k |
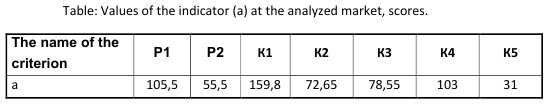 Table: Values of the indicator (a) at the analyzed market, scores Alexander Shemetev t12.jpg:552x105, 17k |
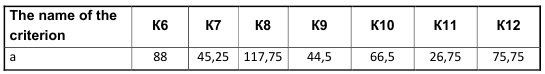 Table: Values of the indicator (a) at the analyzed market, scores Alexander Shemetev t13.jpg:545x74, 14k |
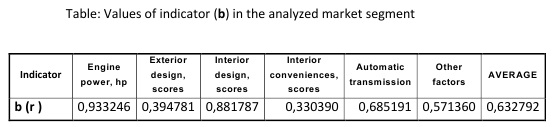 Table: Values of indicator (b) in the analyzed market segment Alexander Shemetev t14.jpg:557x127, 26k |
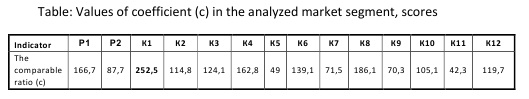 Table: Values of coefficient (c) in the analyzed market segment, scores Alexander Shemetev t15.jpg:529x99, 19k |
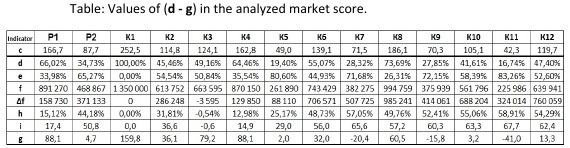 Table: Values of (d - g) in the analyzed market score Alexander Shemetev t16.jpg:570x148, 52k |
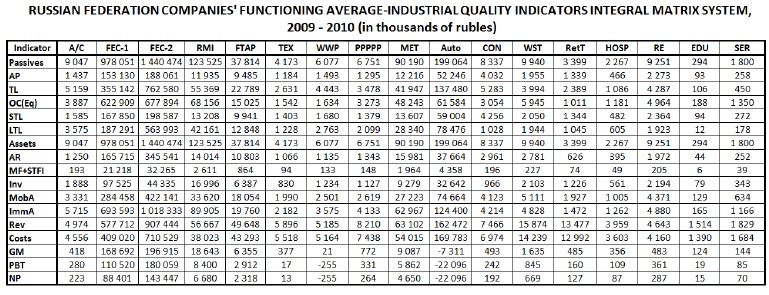 The author of this paper has made an emphasis on the analysis of passives of companies which function in a certain industry, realizing that they perform the structure of price of companies’ functioning at the market. The asset structure was calculated by the author of this paper based upon linear approximation of the industry (except for the performance of receivables). Alexander Shemetev t17.jpg:769x295, 161k |
 The author of this paper has made an emphasis on the analysis of passives of companies which function in a certain industry, realizing that they perform the structure of price of companies’ functioning at the market. The asset structure was calculated by the author of this paper based upon linear approximation of the industry (except for the performance of receivables). Alexander Shemetev t18.jpg:777x114, 39k |
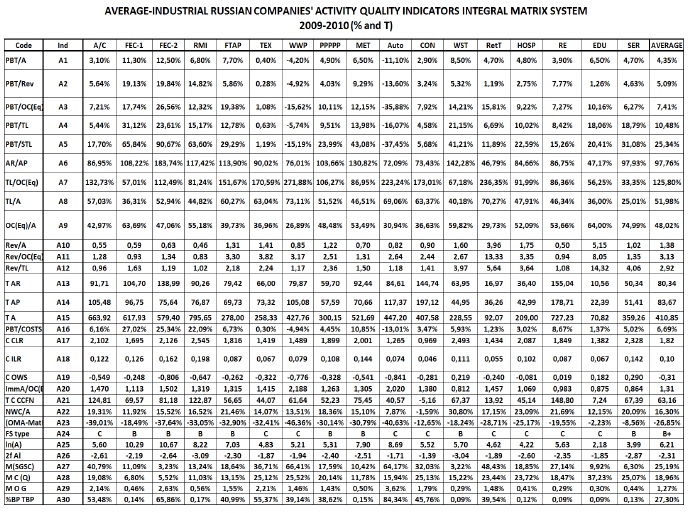 Along with quantitative data on the macro-segmentation of the market, the author of this paper, Alexander Shemetev, has calculated and key quality measures. Alexander Shemetev t19.jpg:690x513, 232k |
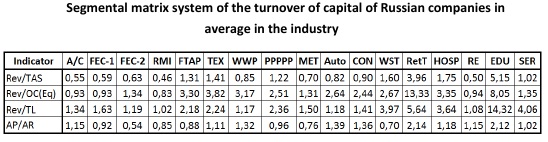 Segmental matrix system of the turnover of capital of Russian companies in average in the industry Alexander Shemetev t2.jpg:548x142, 48k |
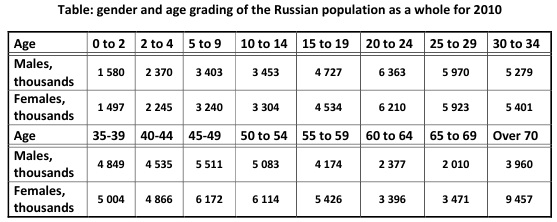 Table: gender and age grading of the Russian population as a whole for 2010 Alexander Shemetev t22.jpg:557x222, 51k |
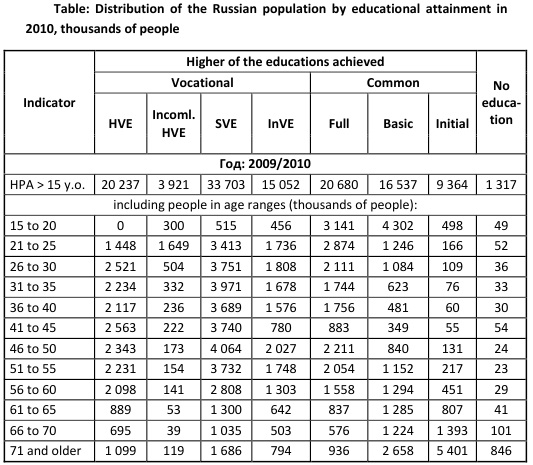 Table: Distribution of the Russian population by educational attainment in 2010, thousands of people Alexander Shemetev t24.jpg:533x465, 113k |
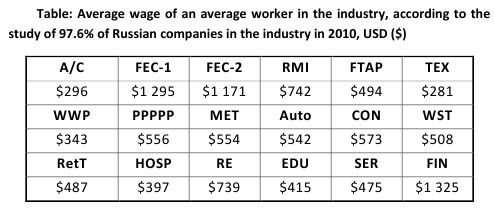 Table: Average wage of an average worker in the industry, according to the study of 97.6% of Russian companies in the industry in 2010, USD ($) Alexander Shemetev t25.jpg:494x208, 39k |
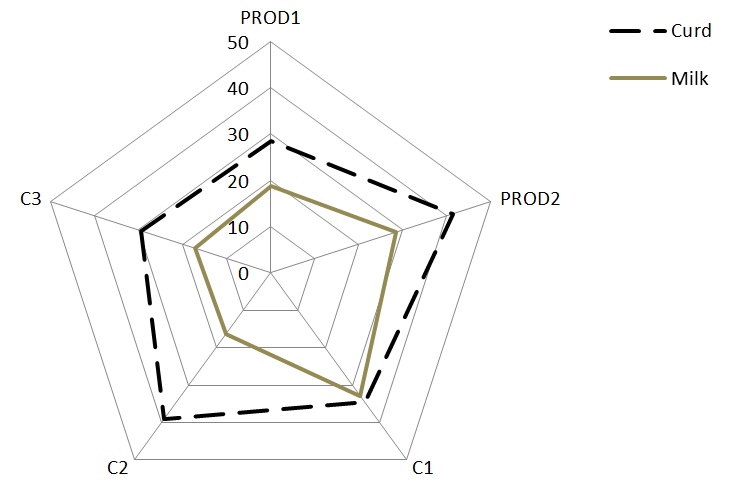
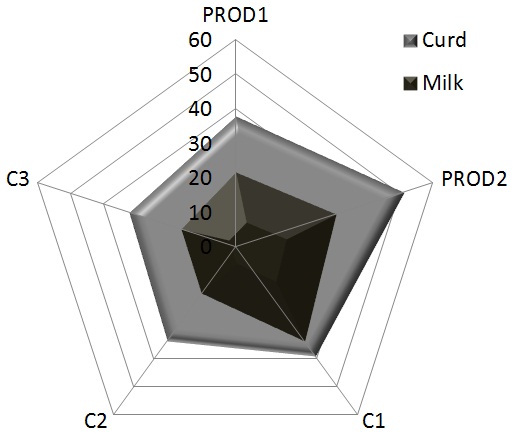
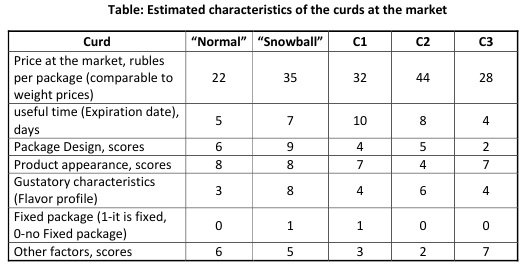 Table: Estimated characteristics of the curds at the market Alexander Shemetev t3.jpg:523x265, 50k |
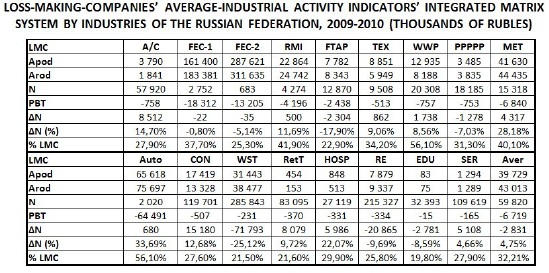 An important indicator of insolvency is a loss-making of company, that is, the inability of companies to generate net profit from their activities. The following is an integral matrix system of the industry average performance of loss-making companies by branches of the Russian Federation. Alexander Shemetev t34.jpg:549x273, 96k |
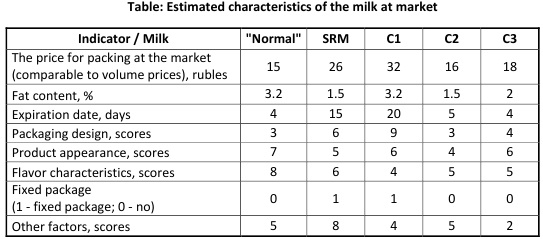 Table: Estimated characteristics of the milk at market Alexander Shemetev t4.jpg:543x239, 51k |
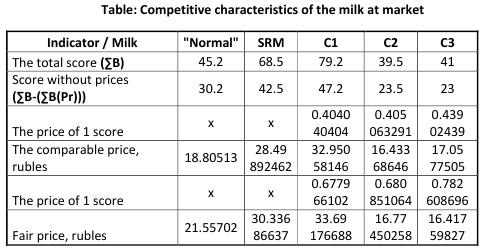 Table: Competitive characteristics of the milk at market Alexander Shemetev t5.jpg:481x249, 53k |
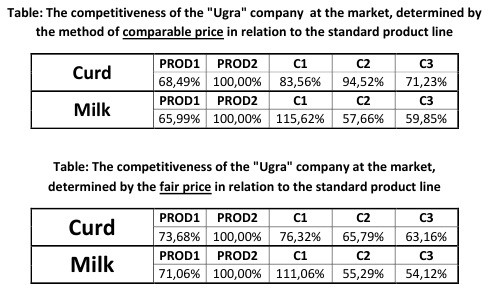 So, if we transform the competitiveness indicators of the "Ugra" company in accordance with the above formula, we obtain: Alexander Shemetev t6.jpg:493x295, 61k |
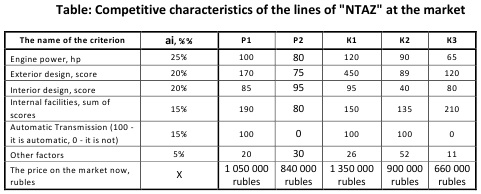 Table: Competitive characteristics of the lines of "NTAZ" at the market Alexander Shemetev t7.jpg:481x194, 42k |
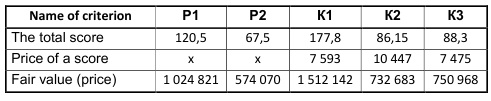 Table: Qualitative characteristics of the lines of "NTAZ" at the market Alexander Shemetev t8.jpg:491x101, 23k |
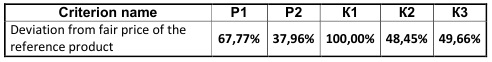 Table: The competitiveness of the company "NTAZ" defined by the fair price in relation to the reference product at the market Alexander Shemetev t9.jpg:492x62, 16k |
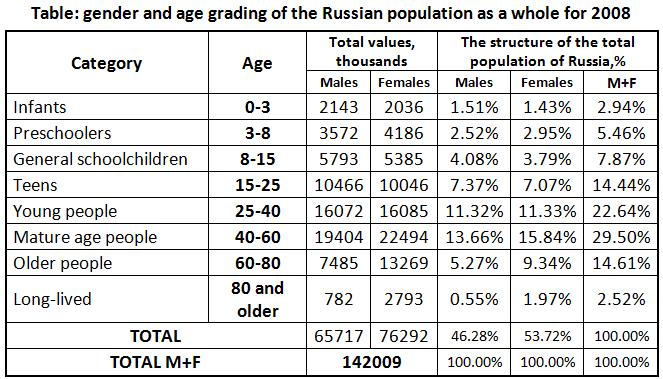 Table: gender and age grading of the Russian population as a whole for 2008 Alexander Shemetev w1.jpg:663x379, 79k |
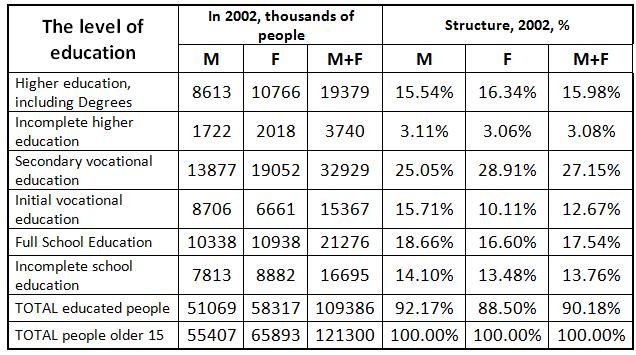 Table: Distribution of the Russian population by educational attainment in 2002, thousands of people Alexander Shemetev w2.jpg:636x355, 68k |
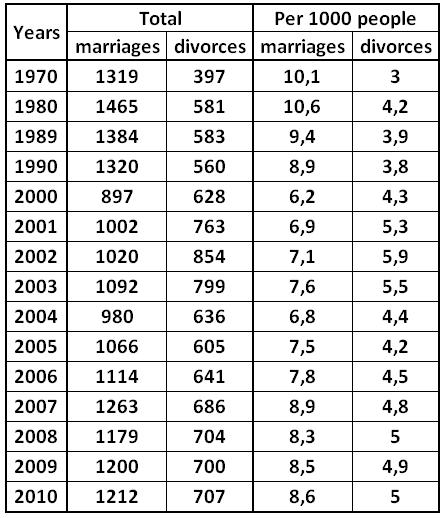 Table: Marriages and divorces in Russia for the period from 1970 to 2007 Alexander Shemetev w3.jpg:443x518, 59k |
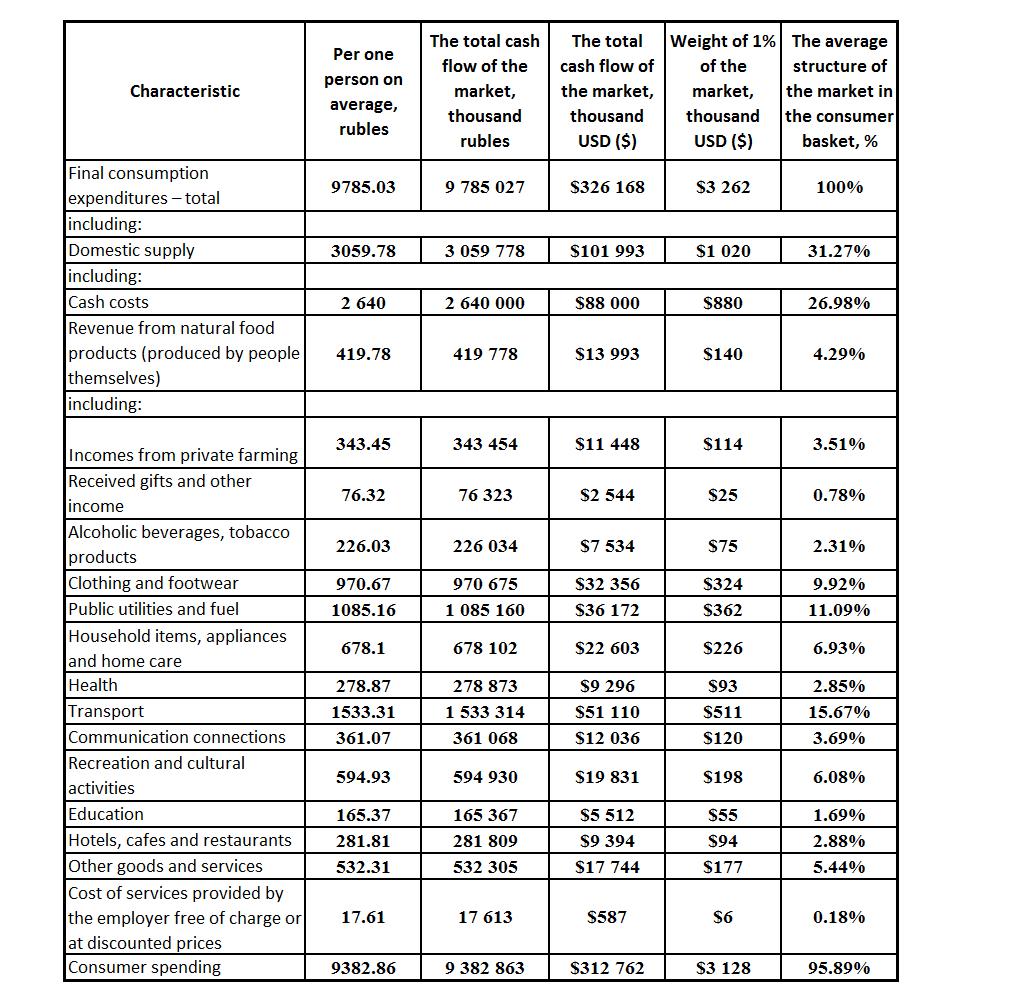
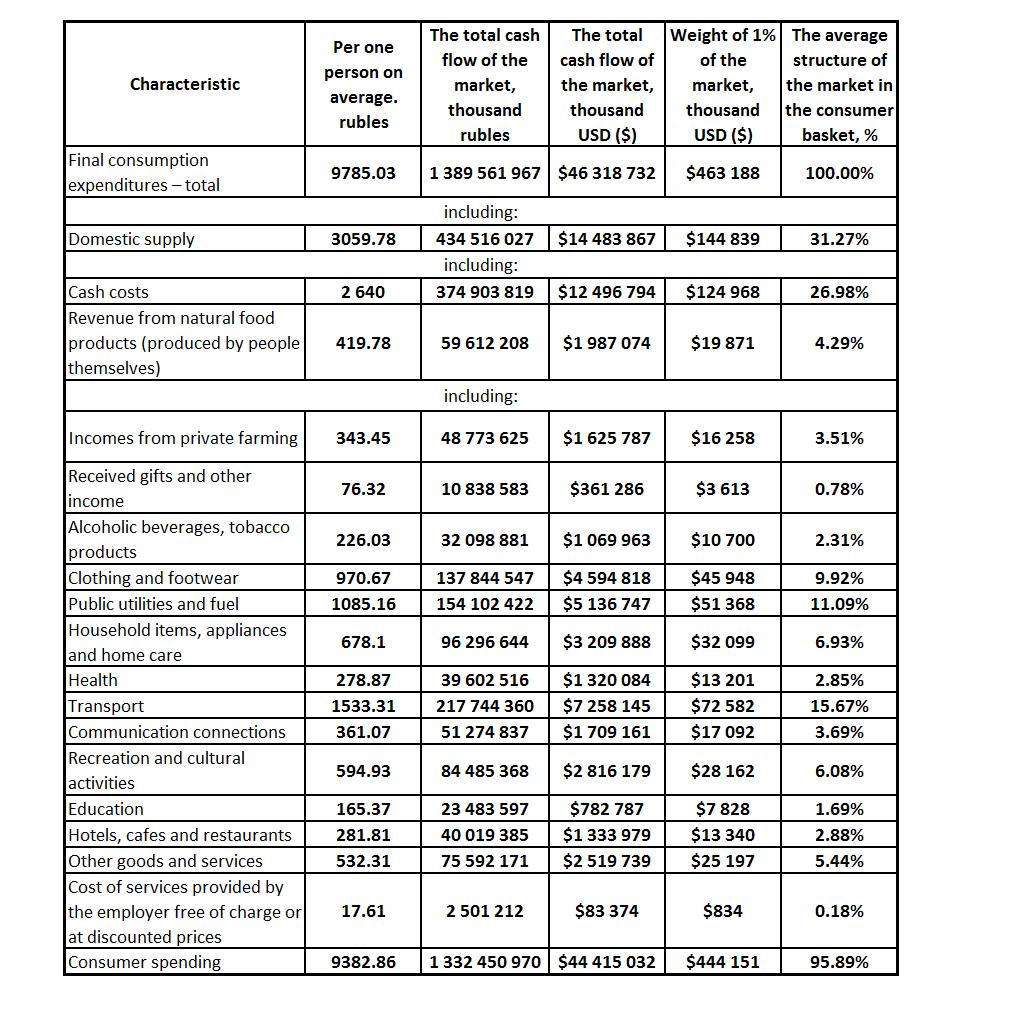 MACD: The segmentation of the consumer market in Russia in 2010. (In terms of total cash flow per 1 month) Alexander Shemetev w4.jpg:1014x1016, 208k |
 MICD: The segmentation of the consumer market in Russia in 2010. Averaged across Russia to the conditioned area of 1 million inhabitants (In terms of total cash flow for 1 month) Alexander Shemetev w5.jpg:1014x1002, 192k |
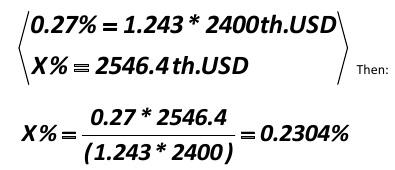 First you need to find the index of discount (we have it 1.243). Then we should find a proportion: Alexander Shemetev w6.jpg:395x170, 13k |